Hydraulic Fracturing Engineering and Software Solution, for Your Most Challenging Reservoirs.
E-StimPlan™
“Frac-Pack” Simulation
On module of E-StimPlan™ (as seen in the Main Window in the figure) is the option to couple 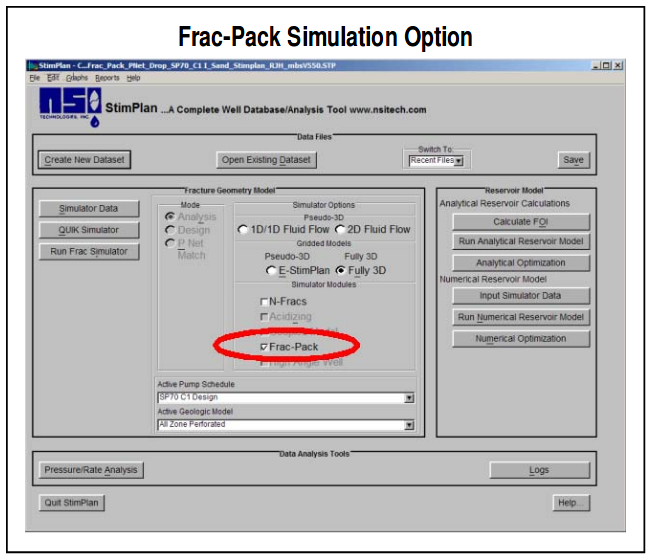 the fracturing simulation (the “frac”) with a wellbore, gravel pack simulation (the “Pack”). This module, its appropriate use, and brief user instructions are included below. NOTE that the appropriate “gridded model” (E-StimPlan™ or fully 3D) MUST be selected in order to utilize the “Frac-Pack” module.
For most frac-pack completions, it is NOT necessary to use the “Frac-Pack” simulation. That is, for the “frac” part of a Frac-Pack (i.e., either the design, and/or analysis of the frac), simulating the “Pack” (i.e., the wellbore, gravel pack part of the operation) is NOT required. When then should this capability be utilized?
Typical cases that might warrant a wellbore simulation might include:
- Cases with very long perforated intervals (say greater than 100+ ft or 30+ m) where one cannot be sure that the entire interval may not “fracture” (due to stress gradients, high fluid loss, etc.).
- Cases with limited clearance between the screen od and the liner id (say < 1” or definitely anything < 0.5”). The combination of a relatively long perforated interval with narrow clearance would definitely be a case that should be examined using the wellbore simulation — i.e., a “FracPack” simulation.
- Any case where unusual behavior has been noted uring the treatment, and/or sand control failure has occurred following a frac-pack are cases where the “Frac-Pack” simulation can be used in a post-analysis mode. The case below illustrates such a post-analysis.
As a final note — NOTE that the Frac-Pack simulation is not really intended to give any specific output as to the wellbore pack. It is intended to examine “problem cases”, and to use that examination as an aid in determining the “cure”.
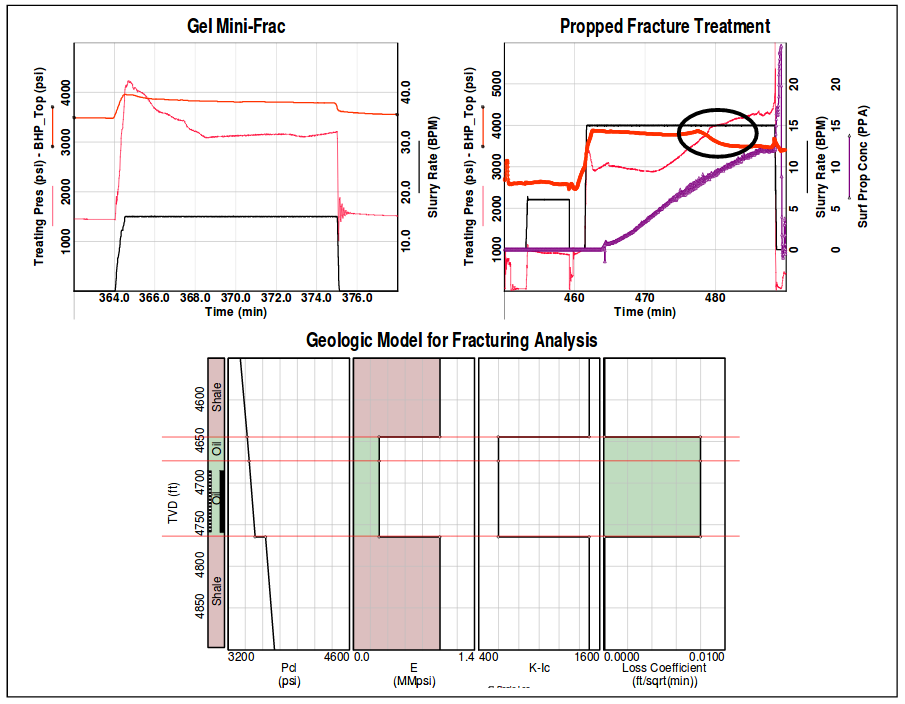
Case HistoryThe user notes below are based on a relatively shallow Gulf of Mexico frac-pack case history. This is briefly illustrated in the figure below. The geology is relatively simple, a simple shale, oil sand, shale environment. Pre-frac tests shows closure pressure equal to 3560 psi, and bottomhole treating pressure throughout the gel mini-frac injection was above 3780 psi. For the subsequent main fracture treatment, from a time of 461 to 475 minutes, the injection pressure is essentially identical to the pressure during the gel mini-frac. Then, at about 475 minutes, the bottomhole pressure begins to increase possibly indicating the start of the desired tip screenout (TSO). However, at about 478 minutes, bottomhole pressure begins to drop. It drops below the 3780 psi injection pressure seen during the mini-frac, and later drops below the closure pressure of 3560 psi measured earlier.
How is this possible? This definitely qualifies as “unusual” behavior that needs to be understood prior to future fracs. In addition, while sand control was achieved, post-frac production was very dis-Frac-Pack Simulation Option Page 2 of 9 appointing with a well test showing a positive skin of +32! This is one type of case where the “FracPack” module must definitely be utilized for post-frac analysis.
Frac-Pack
To run a “Frac-Pack” simulation, first “Frac-Pack must be selected (along with the gridded model appropriate for the expected fracture geometry) from the StimPlan™ Main Window (as seen above).
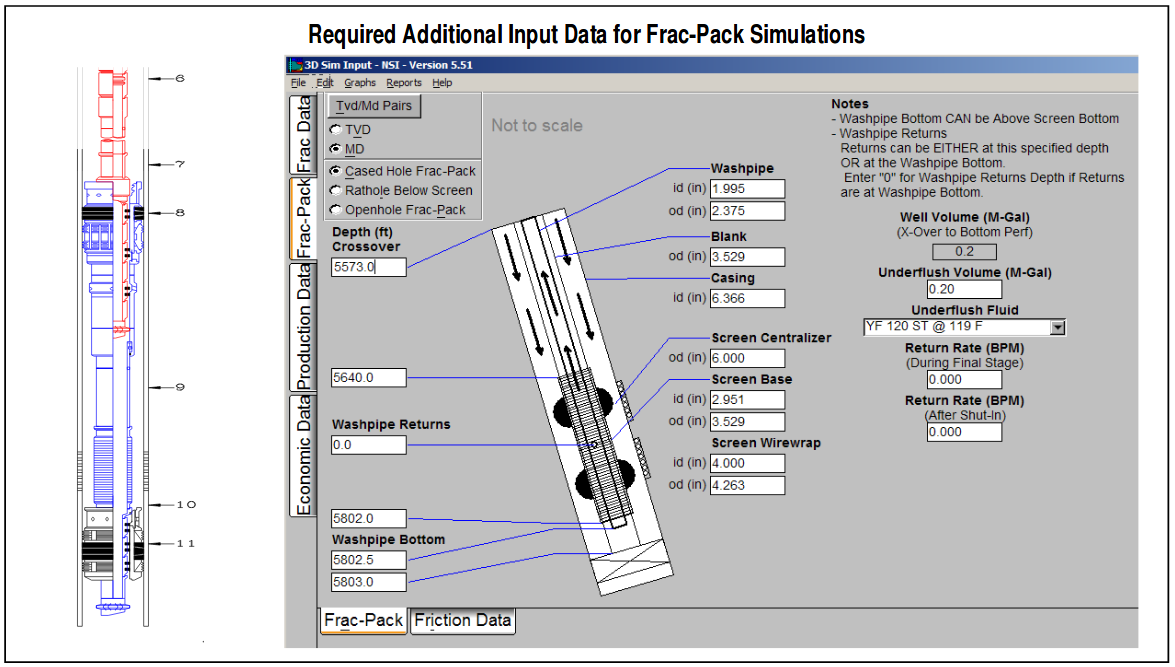
Simulator DataIf “Simulator Data” is then selected, the “Frac-Pack” input tab (upper-left) will be active, and this special input dialog can be accessed. This will require a completion diagram as seen in the figure below. This well completion information can be used to input the required depths, diameters, etc. needed for the wellbore simulation.
The data below is found by opening the StimPlan™ file: Tutorial_Frac_Pack_01.STP.
In addition, input must be provided for:
- Underflush Volume — For a “Frac-Pack”, one must not flush the wellbore all the way to the top perforation in order to leave sufficient gravel in the wellbore to achieve a “Pack”. This input specifies the volume of “underflush”. For the case above, the intention is to displace the wellbore down to the crossover tool, leaving everything from the crossover tool to the perforations filled with a 12 PPG slurry (the concentration of the final treatment stage).
- Underflush Fluid — If the underflush volume is less than the volume from the crossover to the bottom perforation, then this specifies the fluid type which displaces the final treatment stage past the crossover.
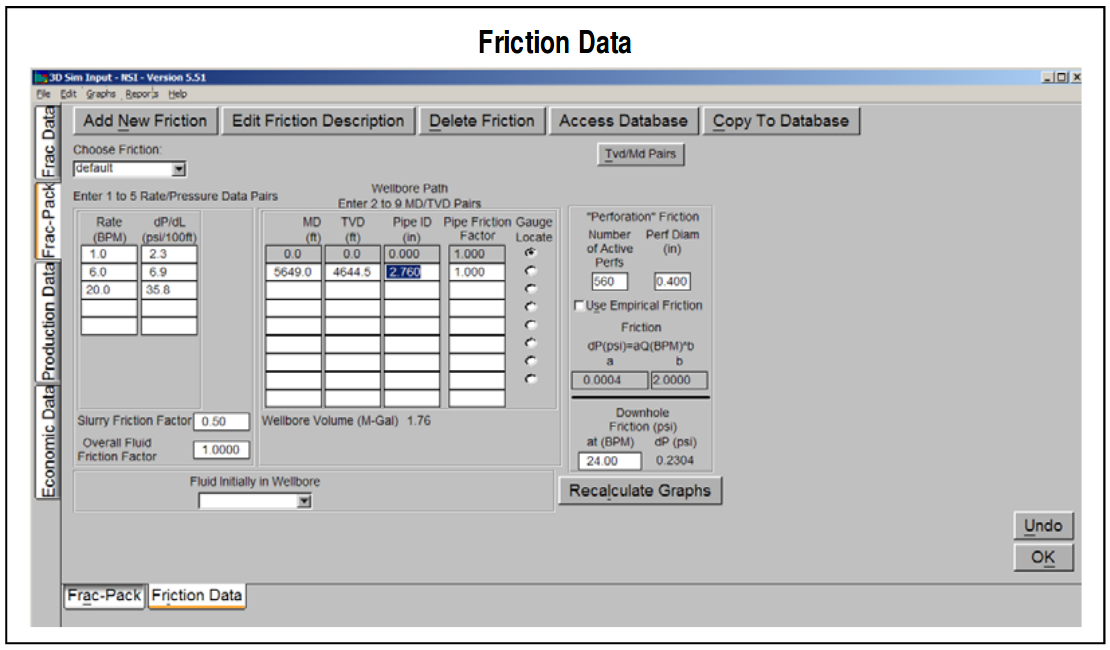
Friction data input is the same as for normal fracturing cases, and this input dialog is identical to the input found under the “Frac Data” tab at the top-left. Note, however, that the inputs for the pipe friction data is NOT for the gravel pack screen/ liner annulus, etc. The pressure drop inside the gravel pack area is calculated internally within the simulations. The pipe friction input data is strictly for the tubing from surface to the top of the crossover.
However, some input for perforation friction is REQUIRED for the Frac-Pack simulations.
User Notes – Execute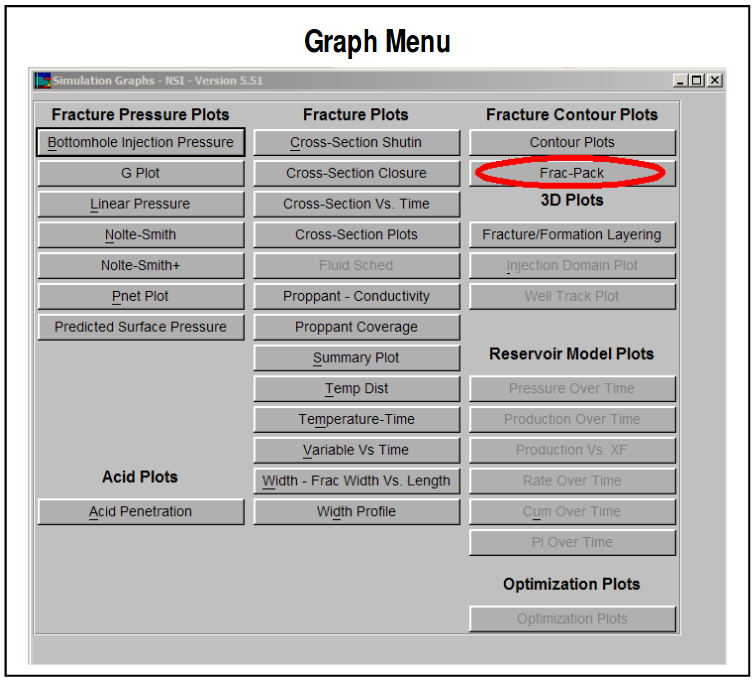
The simulation for a “Frac-Pack” model is the same as for any fracture case. Simply select “Run Frac Simulator” from the StimPlan™ main window. When the simulation is completed, the Graph Menu will be displayed as seen in the figure. The “Frac-Pack” output will now be active, as seen circled in red.
User Notes – Output
The only special output for “Frac-Pack” simulations is via the special plots opened using the “Frac-Pack” graph selection above. This opens the graph module seen in the figure, and this includes four output options.
- Cross Section — The
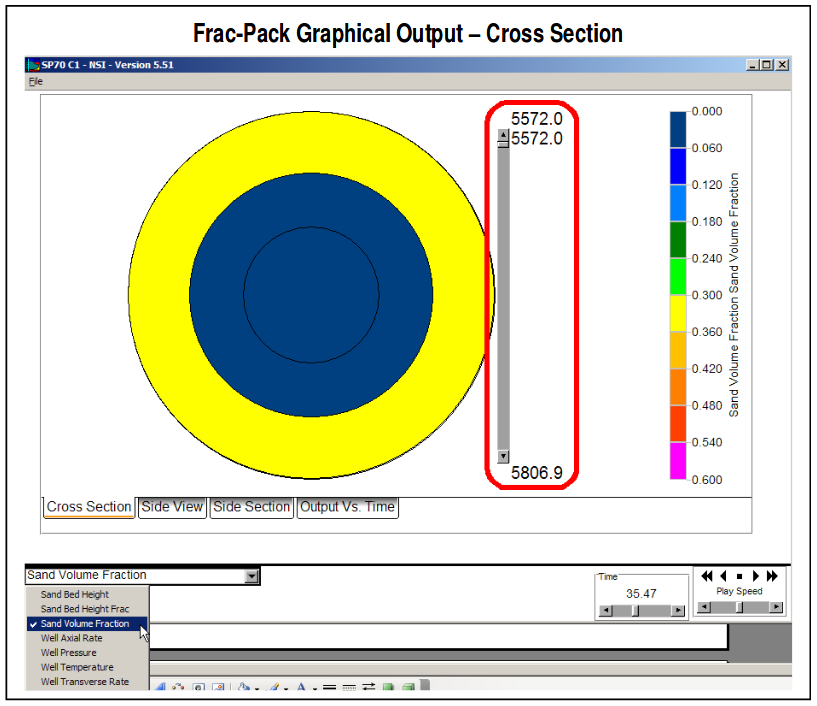 option seen in this figure is the “Cross Section”. Several variables including “Sand Volume Fraction” (i.e., a volume fraction of 0.60 represents a 40% porosity “pack”), Pressure, Temperature, etc. This can be viewed at different depths using the slider bar outlined in red.
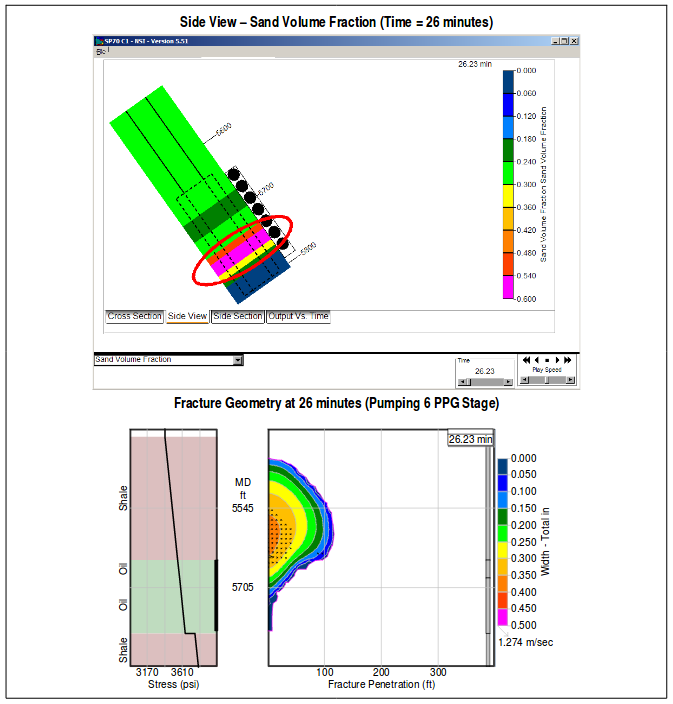
 - Side View — A Side View is seen below, and this is a much more important output than the cross section view above. This gives a view of looking at the gravel pack from the side. This is only used to look at “Sand Volume Fraction” over the vertical interval. This can be viewed at different times Graph Menu Frac-Pack Graphical Output – Cross Section Page 6 of 9 using the time scroll bar at the lower-right.
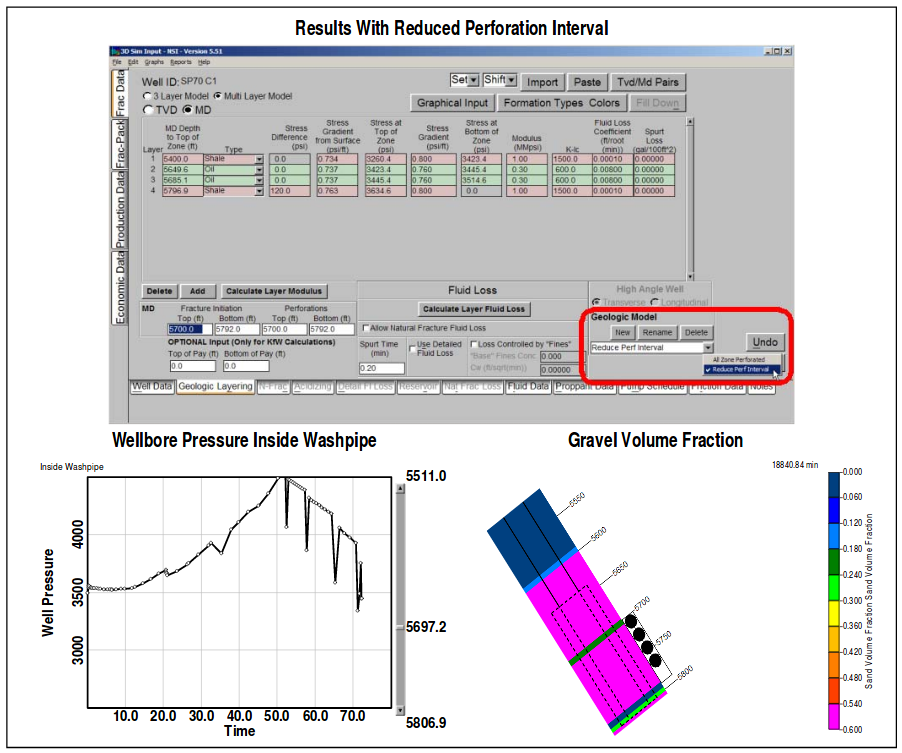
This view is ONLY used to contour the gravel volume fraction. As seen below, for this case history, this shows a bridge forming at about 5760’ MD due to the upward height growth and the resulting lack of flow down to and through the bottom perforations. This is clearly undesirable behavior!
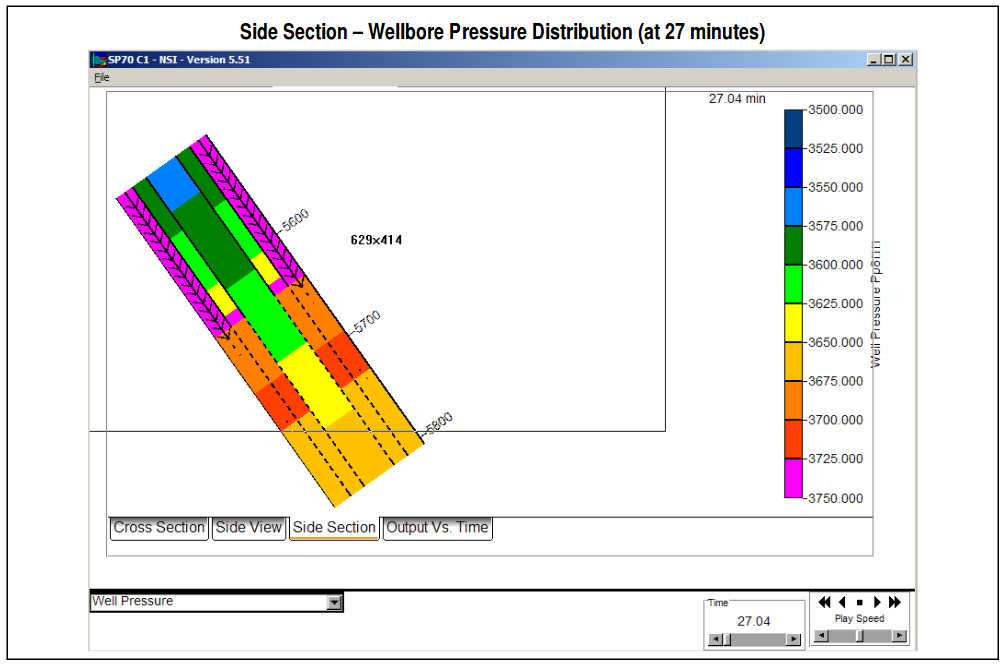
- Side Section — The “Side Section” is similar to the “Side View”, with the difference that it is a cross section, and thus shows conditions INSIDE the gravel pack screen and washpipe. This view can be used to show multiple variables (wellbore pressure, temperature, gravel volume fraction, etc.
For this case history, a “Side Section” of wellbore pressure at 27 minutes shows the bridge that forms having a dramatic effect on the wellbore pressure distribution. Pressure at the bottom of the well (and inside the washpipe where the bottomhole pressure is measured) drops below the injection pressure at the top of the perforations.
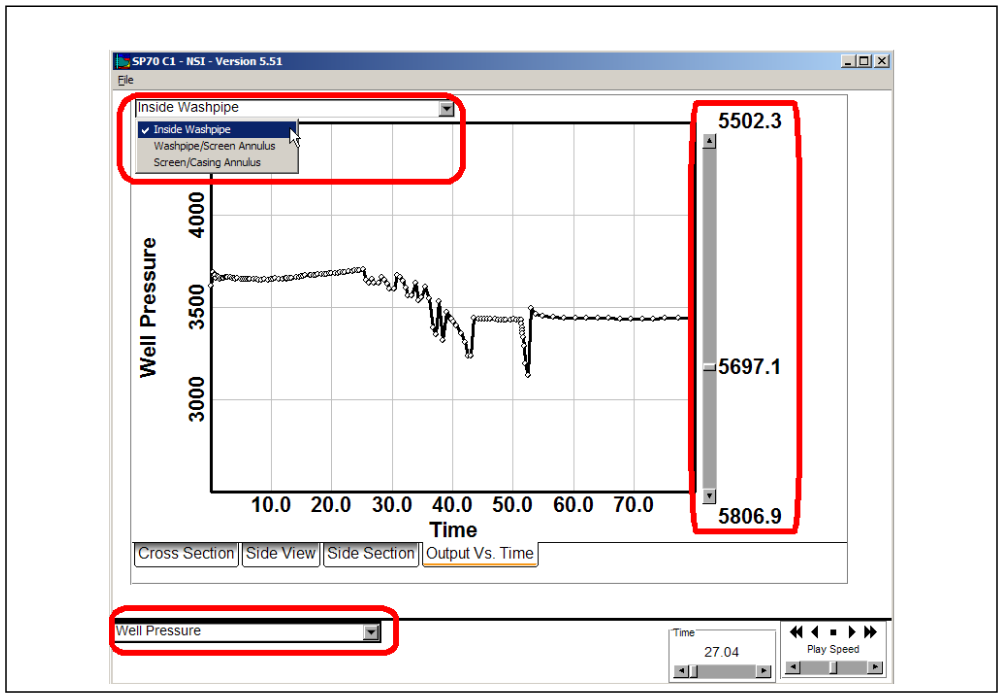
- Output Vs. Time — The final output is a Variable Vs. Time plot as seen below. This can be used to plot specific variables such as wellbore temperature, pressure, etc. during the job. In the example below, Pressure (Inside Washpipe) is plotted versus time at a depth of 5,697’ MD (the depth of the bottomhole gauge inside the washpipe).
This shows the bottomhole pressure beginning to decrease at a time of about 25 minutes, dropping from about 3800 to 3400 psi — just as observed in the actual job. Thus, the “strange” behavior may be indicating massive height growth and a very poor frac (and gravel pack) over the net pay — explaining the poor well performance.
This discussion has illustrated a typical utilization of the “Frac-Pack” module. The case in question showed very poor well performance, and unexpected bottomhole pressure behavior. The question was “What caused these two things, were they connected, and what can be changed to “cure” the problem?”.
The “cure” appears to be to control the massive height growth into the shale. As seen below, if one selects the “Reduced Perforation Interval”, and then re-runs the Frac-Pack Simulation, the results are drastically different. Massive height growth into the shale is avoided, with a resulting very good fracture, a large net pressure increase, and a good wellbore pack over the target formation.