Hydraulic Fracturing Engineering and Software Solution, for Your Most Challenging Reservoirs.
3D Fracture Geometry Modeling
Real or Pseudo?
There are always five questions that must be answered for hydraulic fracture design; fracture length, height, and width, where proppant/ acid is placed, and fracture direction/ azimuth. Four of these five critical parameters come from fracture modeling; thus, fracture modeling is 80% of the answer.
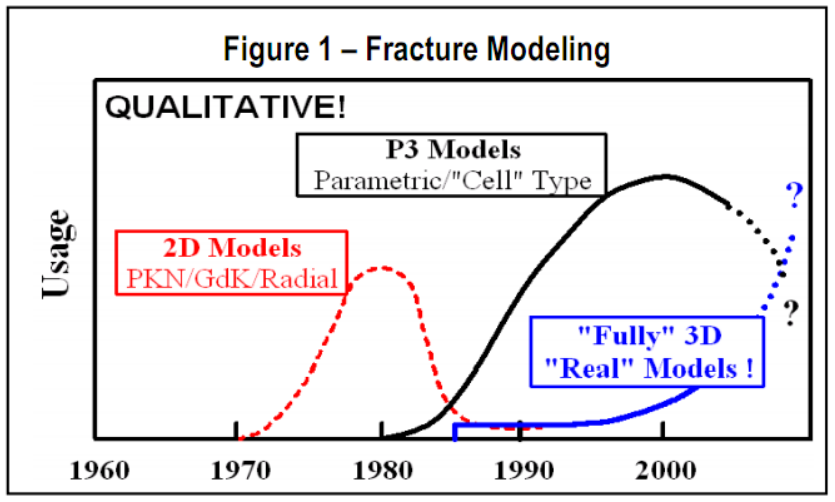
A qualitative history of fracture modeling is seen in Fig. 1. The industry used 2D models, where the user specified fracture height and the model calculated the fracture width & length, for only 6 or 8 years. These were quickly supplanted by Pseudo-3D models with the first of these models commercially available in 1981. These Pseudo-3D models approximately calculated fracture height, then calculated fracture width/ length much the same as the original 2D models did.
Calculating the fracture height was a big step forward. Net pressure inside the fracture is a strong function of fracture height, and fracture height is a function of net pressure. Thus, mathematically, fracture height is a strong function of fracture height! Thus there is no basis for estimating fracture
height as required for 2D models. Pseudo-3D models were an important advance at that time. However, it is difficult to believe that these approximate, pseudo models are still used over 25 years later! Particularly as more robust 3D models, with a rigorous solution to mathematical fracture propagation equations, have been available since the mid-80s.
Whatever the reasons for this technology stagnation – it is time to move on! P3D models may be useful for preliminary designs and scoping studies, but except in very simple geologic environments they give wrong answers and cannot be used for final fracture analysis/ design.
“We don’t need 3D models as we don’t have the data anyway”
This is a commonly heard excuse for not using rigorous fracture models. But, what about cases (not all that rare) where we do have the data? Do we still use models that give wrong answers for our designs?
The following example is a hard rock case of a propped fracture pumped from a horizontal wellbore (drilled parallel to the expected fracture azimuth). Extensive data was collected prior to the treatment including dipole sonic log, cores for lab stress-strain (modulus) testing, in situ stress tests in several zones, and a gel minifrac in the actual completion interval. All of this data was then used in a Pseudo-3D model to design a frac.
This showed the fracture mostly growing down (into the pay) from the perforations (red circle in Fig. 2), with sufficient width over the perfs. Basically, the design showed “All is Fine”. A different P3D model was run for post-analysis, and while details differed, major results were similar, i.e., growth down & “Everything is Fine”.
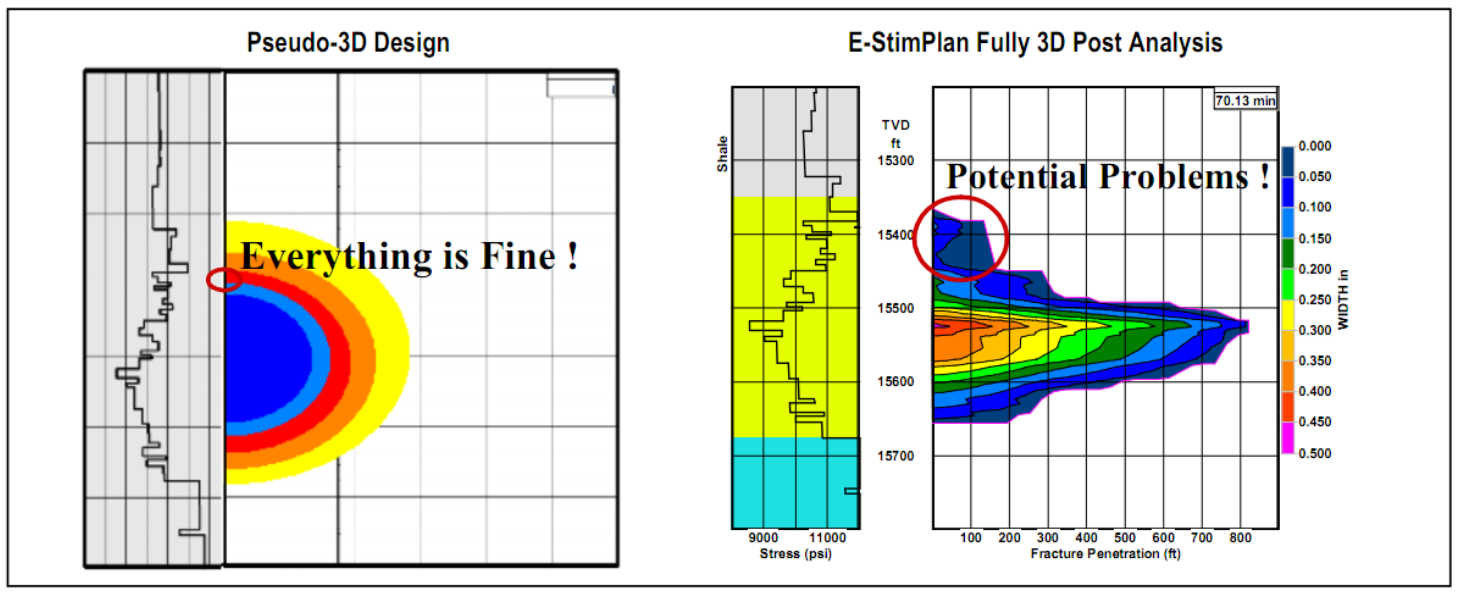
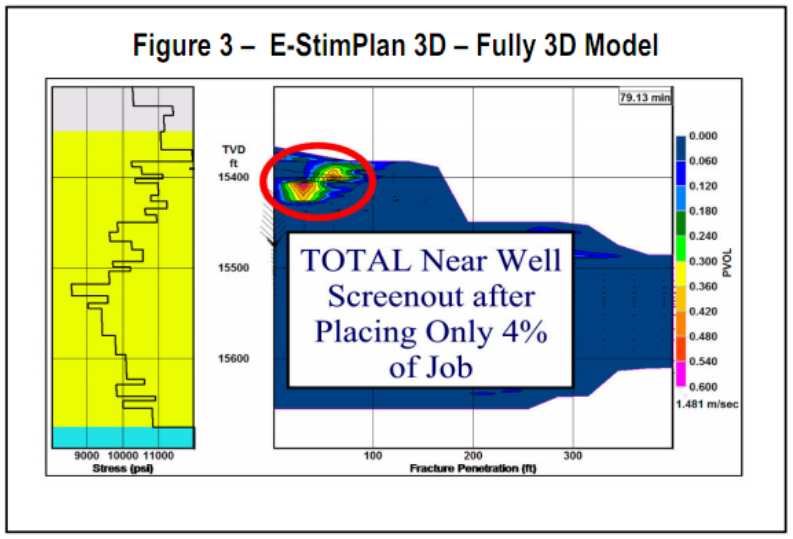
severe fracture width restriction over the perforations and just below the perforations at about 15,100 feet. When proppant starts, bridging occurs. This caused a total screen out with only 4% of the job placed (Fig. 3). The major data collection effort, costing in excess of $200,000, was therefor a waste of time because it was used to generate a Pseudo-3D model that gave the wrong answer!
SPE-TIG Comment – “.... fractures are much better confined and much longer than we thought. ...”
There has been a discussion in the fraccing community that “height confinement is much better than we thought.” However, often what we thought is based on Pseudo-3D models.
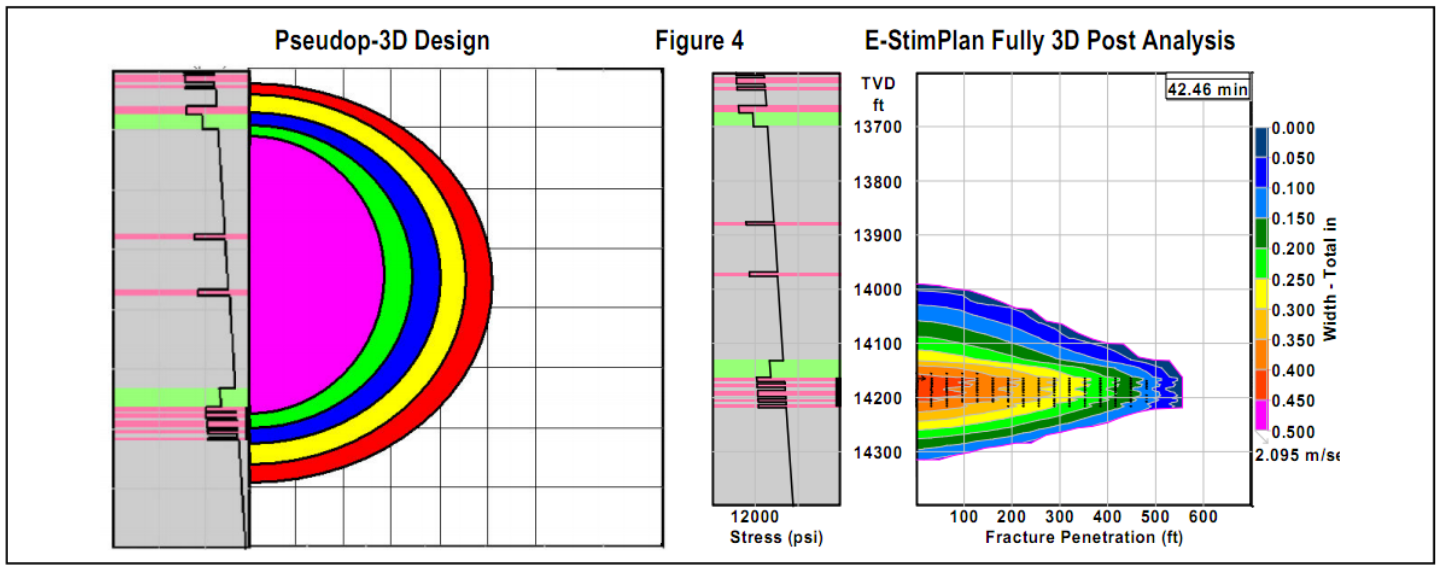
The following example is from a propped fracture treatment in a deep sandstone (14,200 feet) . An extensive set of data were available including: Dipole sonic log, Extended leak-off test in the shale about 1,000 feet above the pay, Sidewall core samples for laboratory stress-strain testing for Young’s modulus, Pre-frac step-rate test, and a Gel mini-frac
Based on this data a Pseudo-3D model was used to design a fracture treatment, this predicted massive upward height growth (Fig. 4).
Post-frac, tracer logs were run (Fig. 5) and based on this the model was “calibrated” to show good confinement. However, the identical data, used in a “Fully 3D”, i.e., “Real” 3D model, shows much, much less height growth and much more fracture length than the P3D results – without artificial “calibration”.
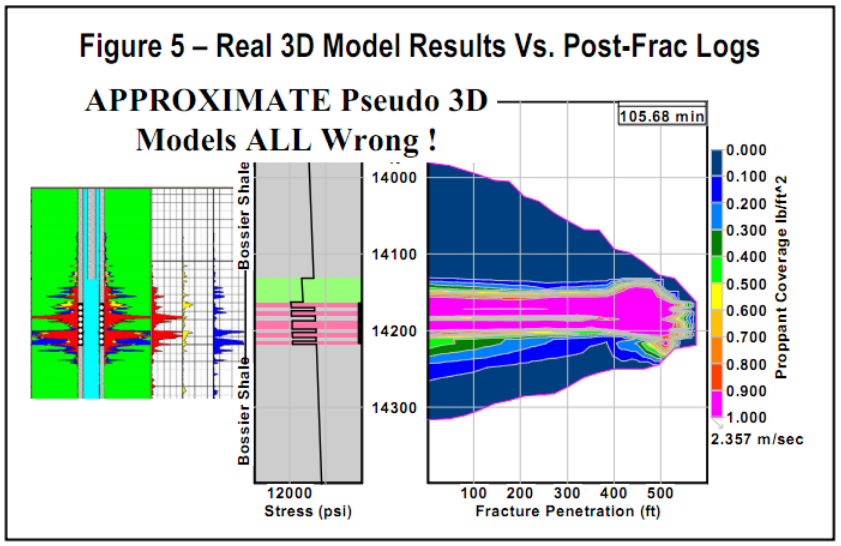
Again, we see that the use of Pseudo-3D models led to an erroneous conclusions in a realistic, complex, layered geologic environment.
Conclusion
In realistic geologies, pseudo-3D models are generally wrong. In a few cases the error may be acceptable but in many the error is so big that they are little more than a cartoon.
Robust 3D models for hydraulic fracture propagation have been available for over 20 years, and are now quick and easy to run, yet they are still not widely used for routine frac design.
NIS’s StimPlan™ is the industry’s most widely used 3D hydraulic fracture design software solution. It offers bot pseudo 3D models and a rigorous planar 3D geometry model, helping design hydraulic fractures in even the most challenging reservoirs. It is time to move on!
NSI Technologies
NSI Technologies is a global leader in software, training and engineering solutions for the design and analysis of well stimulation programs. Founded in 1984, NSI has played a leading role in the development of modern hydraulic fracturing design technology. Through the application of its innovative solutions, NSI helps operators worldwide maximize their well performance while lowering expenditure and reducing their environmental footprint.
Email : StimPlan@nsitech.com